Author: David Drozd, Co-founder, President, Senior Marketing Analyst
How do you make sense of all the news in the marketplace?
- Google for answers?
- Subscribe to a newsletter service?
- Ask your grain buyer what they think?
- Read the newspaper?
- Talk to your neighbours?
- Check out what farmers are saying on Twitter?
- Rely on a reputable grain marketing advisory firm?
When I started farming, I couldn’t make sense of all the news (noise). One article would suggest grain prices should go up, and another would be reason for the market to go down. Who was right?
After taking courses on how to market grain, I learned that on any given day there are several reasons why a market could go down, and just as many reasons for it to go up. How do you decipher all this information?
I found that charting and technical analysis was the answer. Technical analysts believe wholeheartedly that the price action brings out the news. If the market is up at the end of the day, bullish news substantiates the reason for prices being higher. If the market settles lower, the bearish news is referenced.
Therefore, the news is always bullish at the height of a rally and bearish at the bottom. This causes farmers to believe the market will continue to move higher at the top and lower at the bottom. After watching the price action on charts and studying technical analysis for the past 40 years, I found that charting and technical analysis is the only way to cut through the news and identify market highs and lows.
It’s quite simple.
It’s time to sell when 1) the market rallies into resistance, 2) is technically overbought, and 3) especially if a reversal pattern appears. By following this discipline, our clients tell us we are 85% accurate in alerting them to sell at or near a market high. 15% of the time, a market may push through resistance and continue to rally. This is a good thing, as farmers can sell more grain at a higher price.
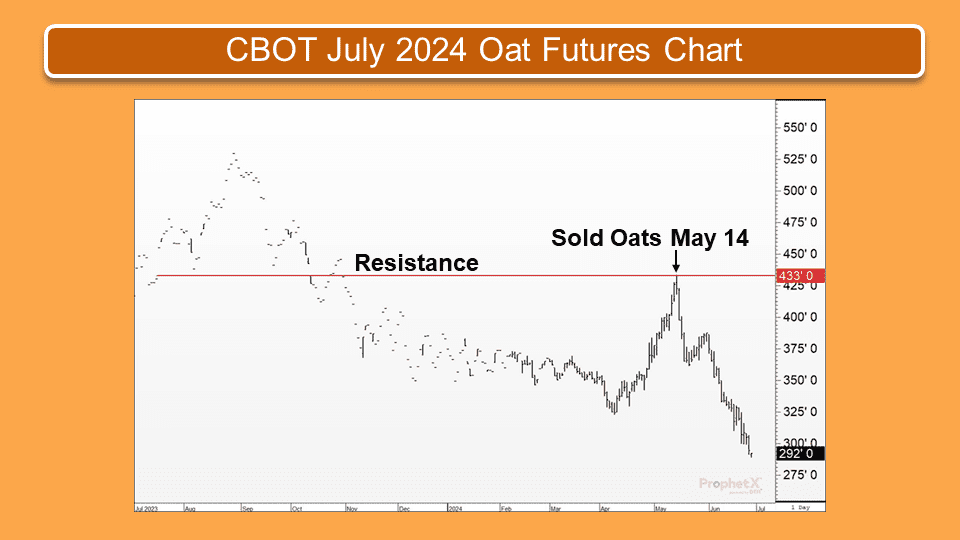
For illustrative purposes, let’s look at the CBOT July 2024 oat futures chart, which had a spring rally in 2024, before turning down.

In the accompanying chart, 1) futures rallied into resistance at US$4.33 and 2) were technically overbought, after rallying $1.10 per bushel in the previous 5 weeks. This left the market at risk of turning down, so we made a recommendation for our clients to sell old and new crop oats on May 14, 2024, even though 3) a reversal pattern had not appeared.
Futures were at risk of turning down to alleviate the overbought conditions. We also cited that failure to exceed resistance at US$4.33 would result in the market turning down, even though the news from a fundamental perspective was extremely bullish, with carryout stocks of oats projected to be at or near a record low level. Plus, oat prices had achieved our objective in the cash market, which was as high as CD$4.75-5.00 in Manitoba, $4.25-4.50 in Saskatchewan, and $4.50-4.75 in Alberta.
What does an extra $1.00 per bushel for oats do for your farm’s bottom line?
A 100 bushel per acre oat crop would gross an extra $100.00/acre. On 2,500 acres, that would be an extra $250,000.00 in gross revenue.
Clients tell us they make their investment in our program back in one recommendation.
Over 40 years experience in watching the charts has enhanced my ability to know when to pull the trigger and when not to pull the trigger. Some call it a sense, instinct or intuition.
Regardless of how we do it, we have an excellent track record that is second to none. The more I focus on the charts and the less I look at the news, the better I am in identifying market trends, market highs, and lows.
Wondering when to sell oats? If interested to learn more, click the link below.
